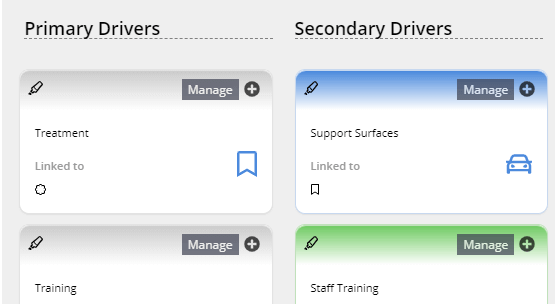
Driver Diagrams
AimiHub implements a quick and easy way to build driver diagrams using visual aids such as colors and icons to link drivers.
Our innovative approach to driver diagrams helps you focus on what is important and helps the teams communicate clearly.
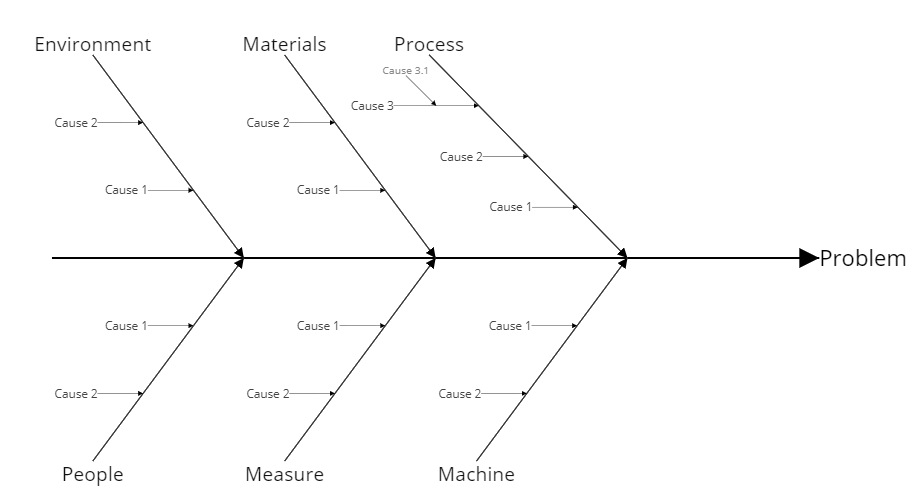
Fishbone Diagrams
Fishbone diagrams (aka Ishikawa Diagrams) have been hard to build up to now due to inadequate tools. Drawing tools or presentation software is used to draw these diagrams which have made the task even more cumbersome.
AimiHub has an innovative approach for the fishbone diagrams. It is as easy as building a tree view of the cause and effects. The fishbone diagram is generated automatically allowing users to focus on what is important instead of struggling with the tool.
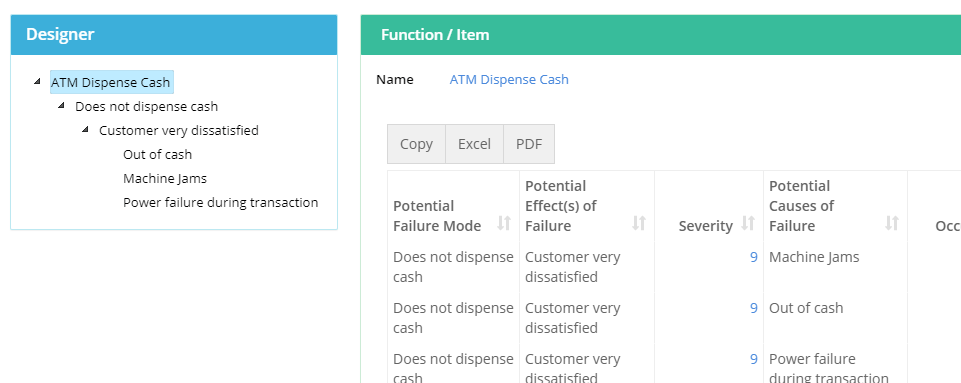
ailure ode and ffects nalysis
Discover issues before they become problems
Failure Mode and Effects Analysis (FMEA) is a structured approach to discovering potential failures that may exist within the design of a product, process or service.
Generally a spreadsheet is used but this results in a cluttered look and makes it very hard to find and share information. AimiHub has a customizable, straightforward and very easy to use FMEA tool that displays the information clearly. A Pareto chart can be generated automatically from the FMEA for further analysis and learning.
Ready to get started?
Email us to book a demo or to discuss how AimiHub may assist you with your projects.
Email Us